
For plants with machines and software from different manufacturers
Automation and AI software for manufacturing
We connect machines, unify their data, and develop software that automates and monitors industrial processes, answers in natural language, and sends alerts.
Plant data is scattered and hard to query
We apply to machine data the same custom development with artificial intelligence that we do for other companies.
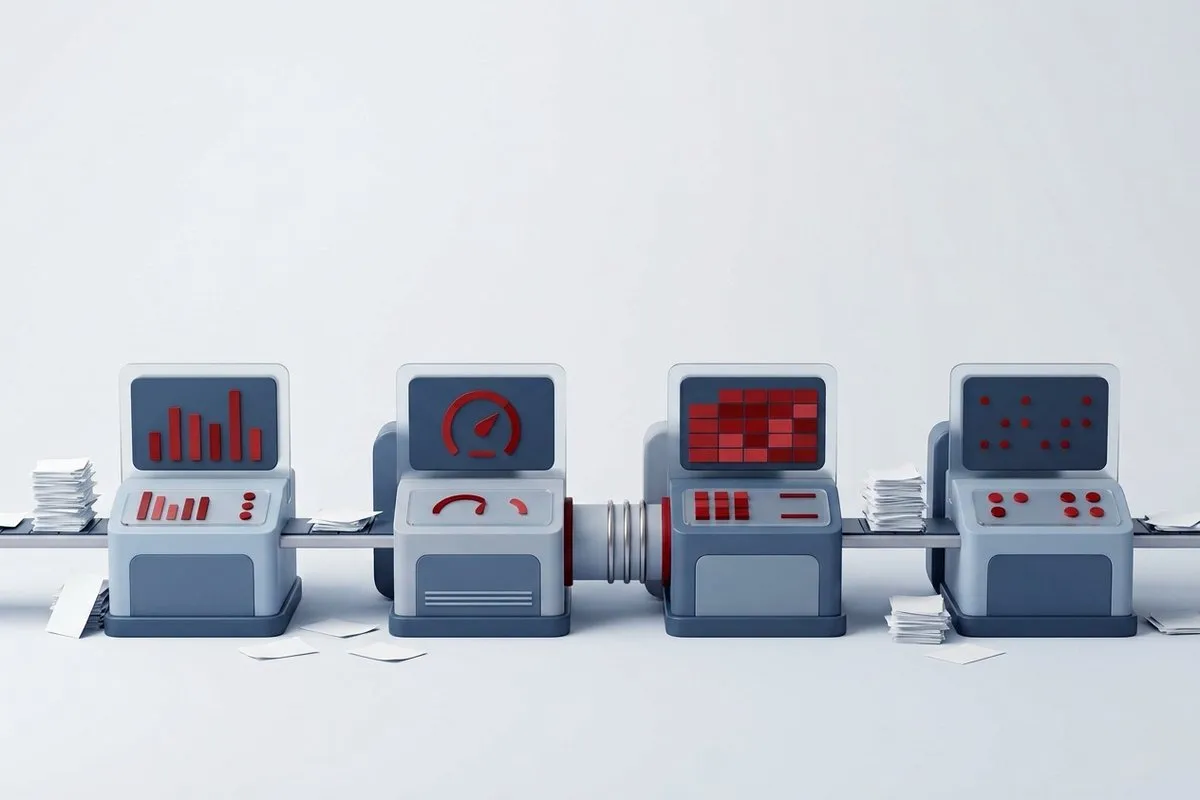
In many plants, each machine has its own screen, its own software, and its own way of storing data. To find out what happened during a shift, the machines have to be checked one by one, or someone has to wait for a report to be prepared.
At Gilsys, integrating artificial intelligence in the plant starts with that problem: we connect the machines, unify their data in a single platform, and develop an AI system that answers questions and sends an alert when an incident occurs.
The first goal is to organize the information
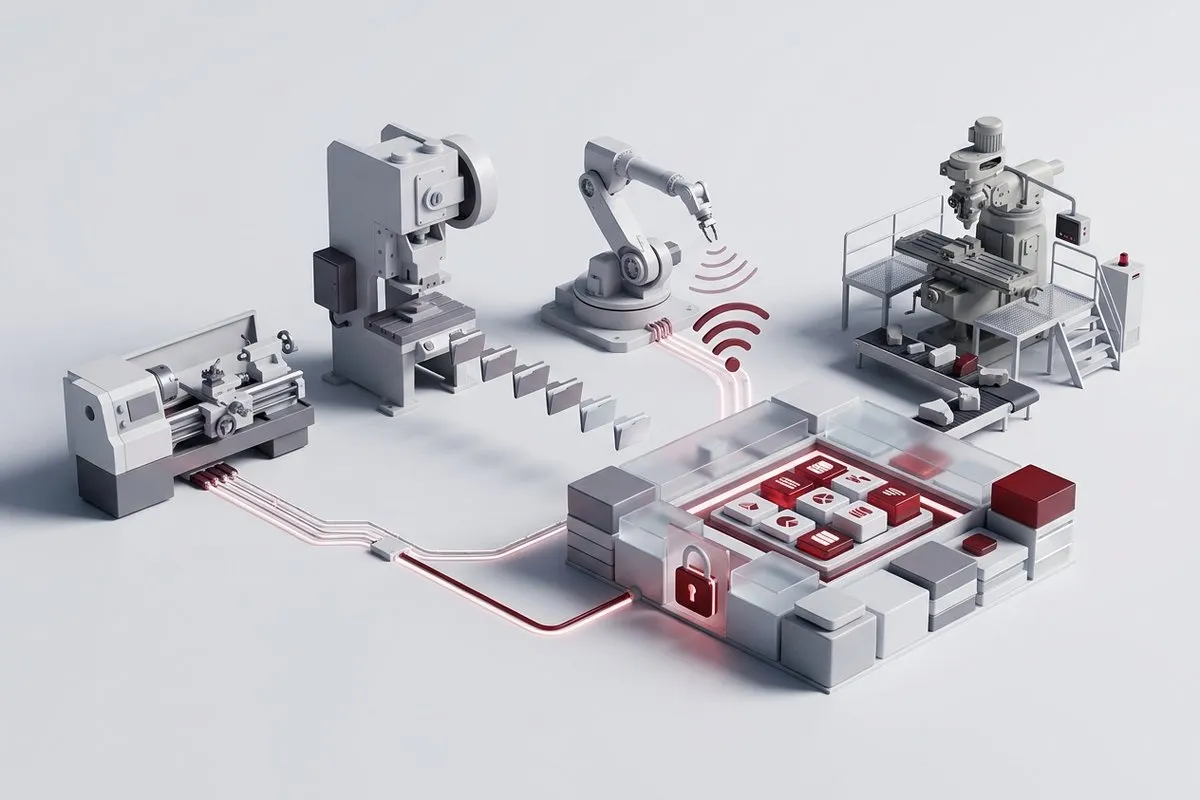
Connecting the machines and unifying their data
Each machine, through the connection it allows
Some have an API; others leave the information in a file, a folder, or a database; others go through the plant's SCADA system or use OPC UA. Together with the factory's IT manager, we study how to connect to each machine.
The step that depends most on each plant
An old machine with no connection may need a gateway or some IoT sensors, and access to the PLCs sometimes goes through the manufacturer or the integrator who installed it.
A common format for all the machines
One machine records a stoppage with a code and another with a text; one reports the temperature every second and another every minute. We collect the data from all of them and convert it to a single format, in a tool we develop for the plant, with its own API. It is the access point for the rest of the components and the one that controls each user's permissions: the same system integration work we do between business management programs, applied to the machines.
Asking questions, receiving alerts, and seeing the plant in real time
Artificial intelligence and automations are added on top of the unified data, custom built for each industry.
Natural language queries
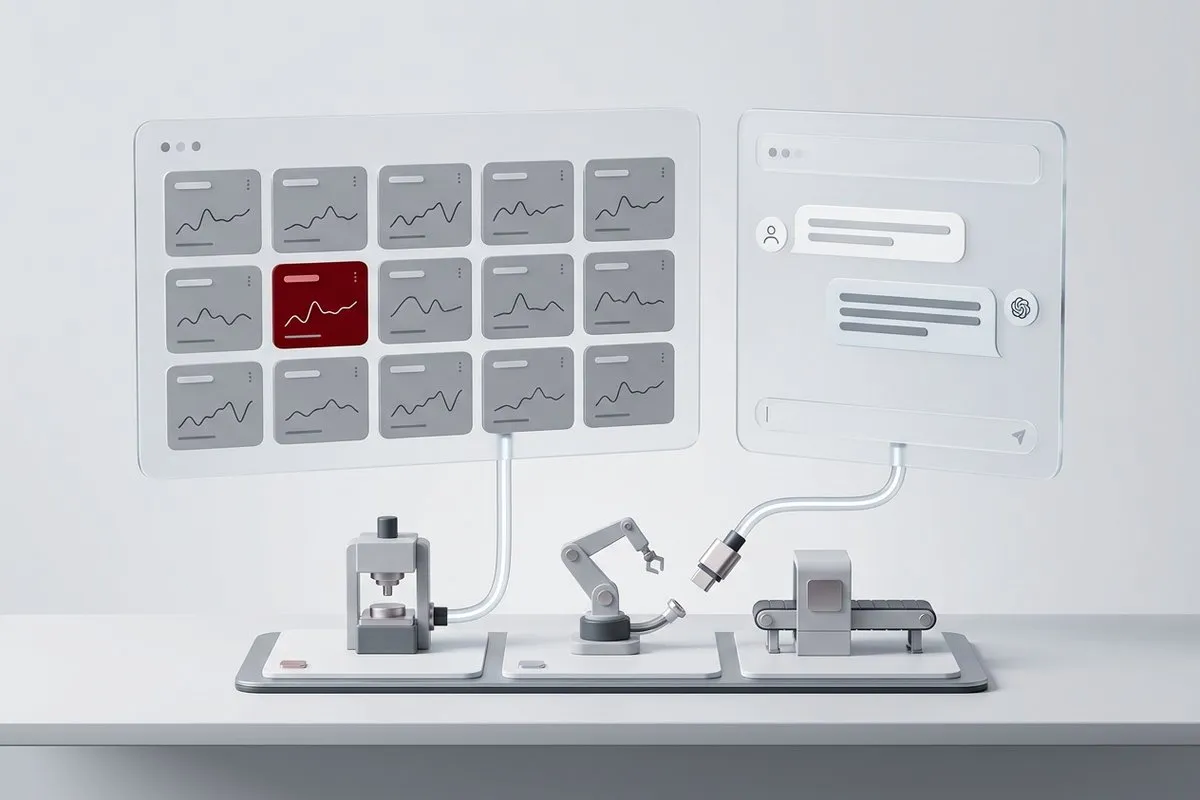
On top of the unified data, we develop an AI layer with MCP (Model Context Protocol), the open standard that lets a language model query data and tools. The AI does not keep a copy of the data: it requests from the API what it needs for each answer. It can be asked, for example, which machine has stopped the most this week and why, or how many parts line 2 has made today.
Automatic alerts
Automated workflows, for example with n8n, send the alerts: if a machine has been stopped for more than ten minutes, a Telegram or WhatsApp message to the maintenance manager; if a temperature goes out of range, an email to the shift supervisor.
AI agents
On top of the workflows, AI agents review the data and choose which alert or workflow to trigger. Since the data arrives every few seconds, a decision AI such as Jev, which responds much faster than a language model, can be used to tell whether a value is normal or whether a stoppage warrants an alert.
Real-time dashboards
Dashboards connected to the same data, for example with Grafana, show the status of each machine in real time: on a screen in the plant, on the computer, or on the phone.
Indicators such as OEE
The unified data also makes it possible to calculate indicators such as OEE (overall equipment effectiveness), as long as the machines record stoppages, speed, and defective parts, and to compare them by shift, by line, or by week.
Permissions by user
Everything runs within a single platform. Someone in sales can have their own automations but cannot see or modify the plant ones; and in the plant, each person sees what is relevant to them.
Example of a plant workflow with integrated artificial intelligence
How a machine stoppage is handled with unified data
A plant with machines from several manufacturers, all connected to the same tool. One of them stops in the middle of the morning.
Logging the incident
The machine records the alert and the tool registers it as a "stoppage".
Alert to the phone
Since the stoppage lasts more than ten minutes, n8n sends a Telegram message to the maintenance manager.
Real-time status
On the plant's Grafana dashboard, the machine appears in red.
Natural language query
In the afternoon, the plant manager asks: "Which machines stopped today, for how long, and why?" The AI answers with the data from all the machines at once.
Data restricted to the plant
The sales team, which uses the same platform for its automations, has no access to this information.
We are software developers: we do not sell a closed package
What we have ready and what depends on each industry
The automations are custom programmed for each industry.
Developed and tested in our environment
The tool with its API, the AI with MCP, the automations with n8n, the agents, the dashboards, and the permissions are developed and tested in our environment, with test data. What changes in each plant is the first step: how each machine is connected.
Each factory has its own machines and data, and each project is different
Our initial work will be to investigate how to obtain the data from each machine and how to integrate it into the platform.
Predictive maintenance with machine data
The anomaly detection algorithms are open source. Whether they work in a plant depends on the historical data of each machine.
Anomaly detection
With the history of temperatures, vibrations, consumption, and stoppages, the algorithms learn how each machine works and send an alert when it starts behaving differently from usual, without waiting for it to stop.
Failure prediction
Predicting a specific failure requires a history with well-documented previous failures. That is why the work starts with detecting anomalies, and prediction is added once that history exists.
First, a test with real data
The test is done on one line or one machine, measuring correct detections and false alarms. Those figures determine whether it is worth extending it to the rest of the plant.
Results on the same platform
Anomalies go into the same platform as the rest of the machine data: they trigger alerts, appear on the dashboards, and can be queried in natural language.
Although every company is different, the workflow is similar
How we organize an AI project in a plant
Review of the machines
What data each machine provides and how it should be accessed, checking with its supplier.
Choice of the first case
One or two machines and a specific need: an alert, a dashboard, or questions in natural language.
Connection and unification of data
We develop the connection with the machines and the tool that unifies their data, with its API.
AI, automations, and dashboards
We add the AI layer, the automated workflows, the agents, and the dashboards, with each user's permissions.
Expansion and adjustments
We add machines and automations, and adjust whatever is needed as the system is used.
Frequently asked questions about AI in manufacturing
Does plant data leave the company?
Is it safe to connect the plant's network?
Can plant data be cross-referenced with orders in the ERP?
How much does an AI project for a plant cost?
Data from the whole plant, in a single system
Tell us what machines there are in the plant and what you want to know or automate. We review what data they provide and propose the first case.